Group data in a report
To see a segment of your data in detail and compare it, use the Group by feature.
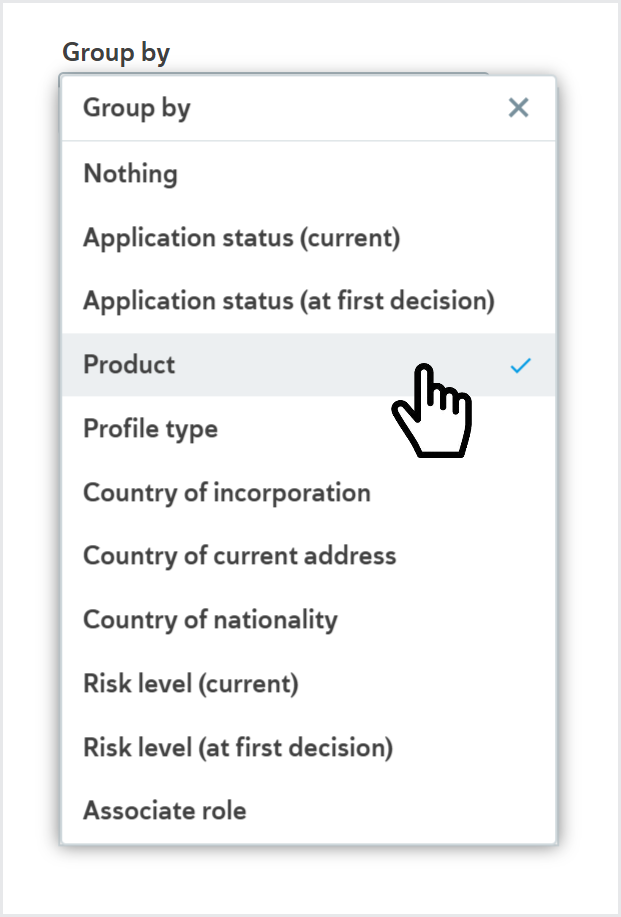
For example, if you're looking at a product application Time to decision report, you can group by Product to compare how product applications for two of your products are performing.
The Group by options that are available depend on the report.
To apply a group:
Open the drop-down and select any option, for example, .

The table and the graph are updated with your selection. The first column of the table displays your group selection as the first column. The graph is re-plotted with one plot line for each element of your group.
This is still the same data selection you were viewing before. Any filter criteria are still applied to your data, and the time range stays the same.

