Application reports
These are the reports for applications:
Conversion rate
Time to decision
Straight through processing (STP)
To view a report, go to the tab, select , and select the report you want to see.
By default, all reports show data for profiles who are prospects and/or customers. To view the data for company associates, change the options for the Profile type filter criterion. To learn more about when your data refreshes, how data is displayed in the graph and table, and more, see About reports.
Conversion rate report
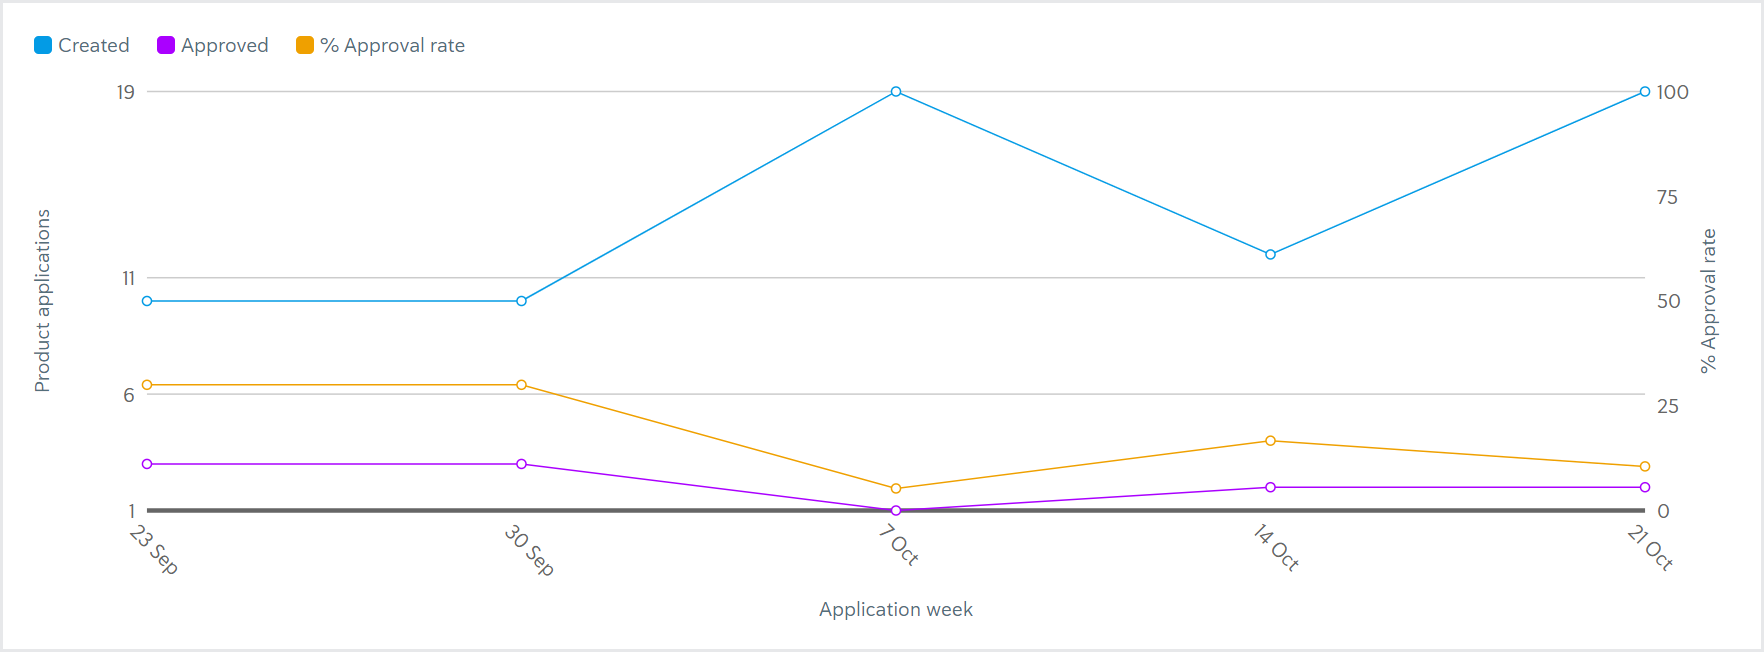
The Conversion rate report shows the percentage of product applications that have been approved each week.
There are three metrics:
Created: The number of applications created that week.
Approved: The number of applications created that week that have been approved since then.
% Approval rate: The percentage of applications created that week that have been approved since then.


In the preceding example, 10 applications were created the week of September 23. Of those 10 applications, three have been approved since, which makes the approval rate 30%. They may have been approved at any time.
Time to decision report
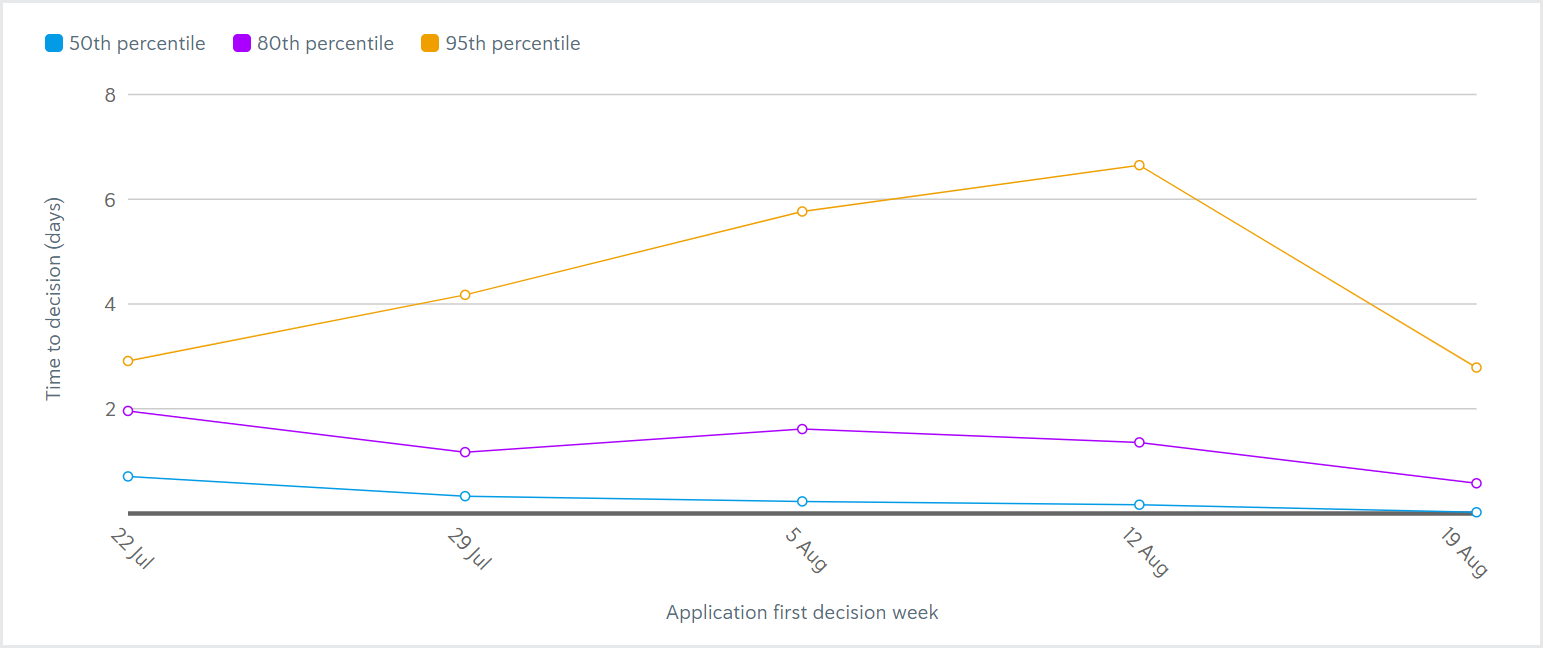
The Time to decision report shows the amount of time it took for a percentile of applications to be decided (approved or rejected) each week.
There are three metrics:
50th percentile: The amount of time it took for 50% of the applications approved/rejected that week to be decided.
80th percentile: The amount of time it took for 80% of the applications approved/rejected that week to be decided.
95th percentile: The amount of time it took for 95% of the applications approved/rejected that week to be decided.


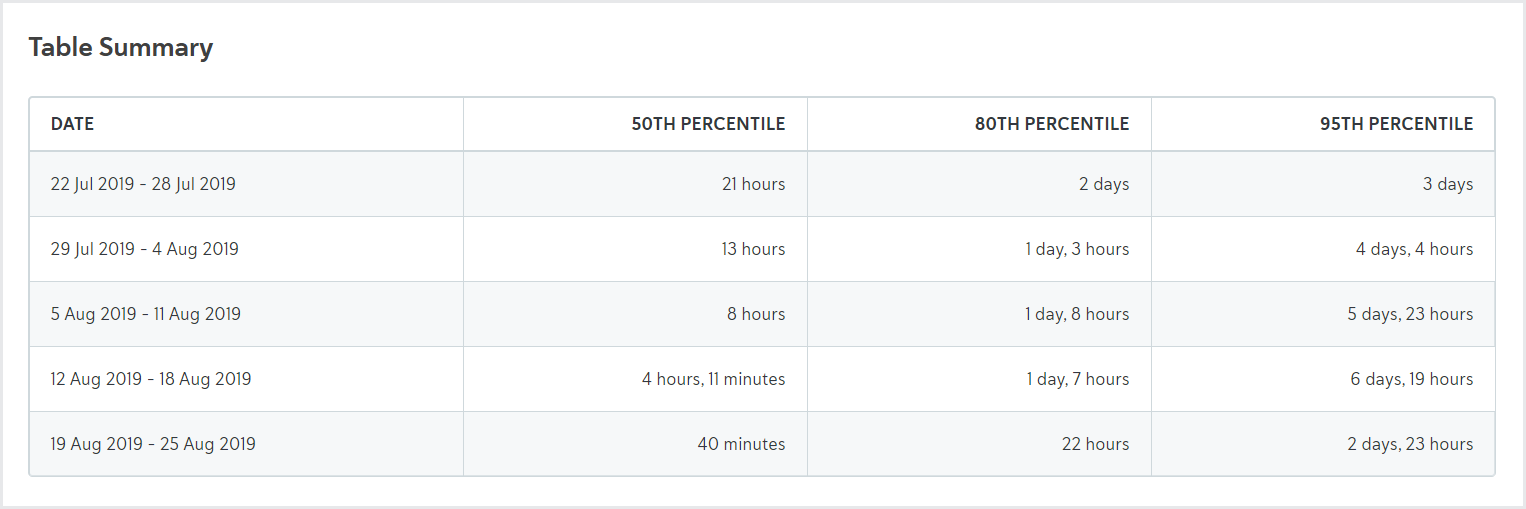
In the example preceding, 50% of the applications approved/reject the week of July 22 were decided in 21 hours or less. 80% of applications approved/rejected that week were decided in two days or less. 95% of applications approved/rejected that week were decided in three days or less.
This report shows the time to the first application decision. For example, if an application was initially approved, then later rejected, the Time to decision report only shows the amount of time before the application was approved. If the Time to decision report shows 0 seconds, there is no data for that plot point. For example, if the 50th percentile of applications in a given week were decided in 0 seconds, there were likely no applications decided that week.
Straight through processing (STP) report
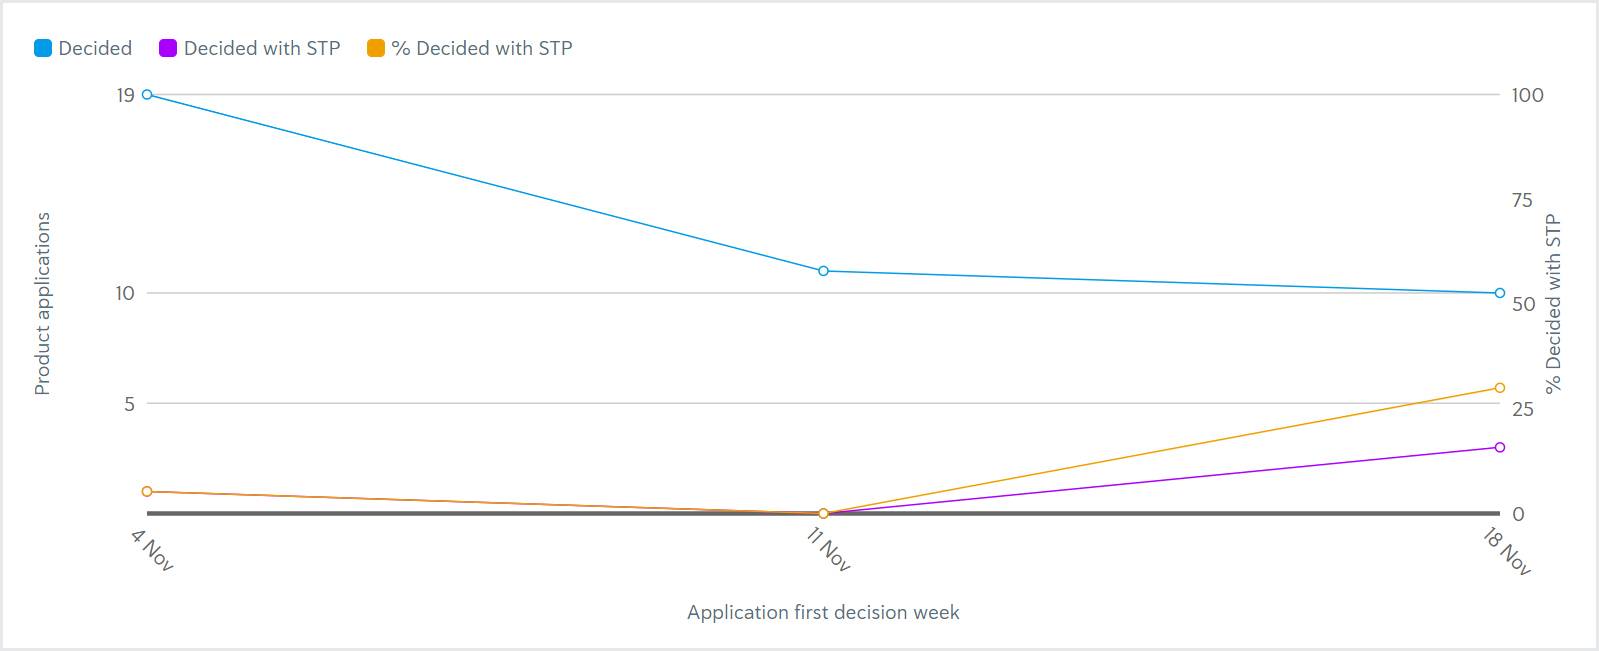
The Straight through processing (STP) report shows the percentage of applications decided that week that did not have any manual intervention during the date range. Learn more about how STP is determined.
There are three metrics:
Decided (all): The number of applications decided that week, including those decided with STP and those decided with manual intervention.
Decided with STP: The number of applications decided that week that did not have any manual intervention.
% decided with STP: The percentage of applications decided that week that did not have any manual intervention.


In the preceding example, 10 applications were decided the week of November 18. Of those 10 applications, three were decided with STP, which means that 30% of all applications decided that week were decided with STP.
This data shows the time to the first application decision. For example, if an application was initially approved, then later rejected, the STP report only shows the amount of time before the application was approved.