Check reports
Check reports show you how the checks on your account are performing.
There are two types of check reports:
Result
Time to completion
You can only see reports for check types that have been run on your account. The first time you run a new check type, it may take a day for the report to be displayed because your data needs time to refresh. To learn more about when your data refreshes, how data is displayed in the graph and table, and more, see About reports.
To learn about the different check types, see About Passfort's checks
Result
Result reports show which results have been returned each week for a particular check type.
To view a Result report, go to the tab, select > , then select the check type you want to see.
The metrics in the report correspond to all possible results for the check type you've selected.
For example, the Electronic identity check has these metrics:
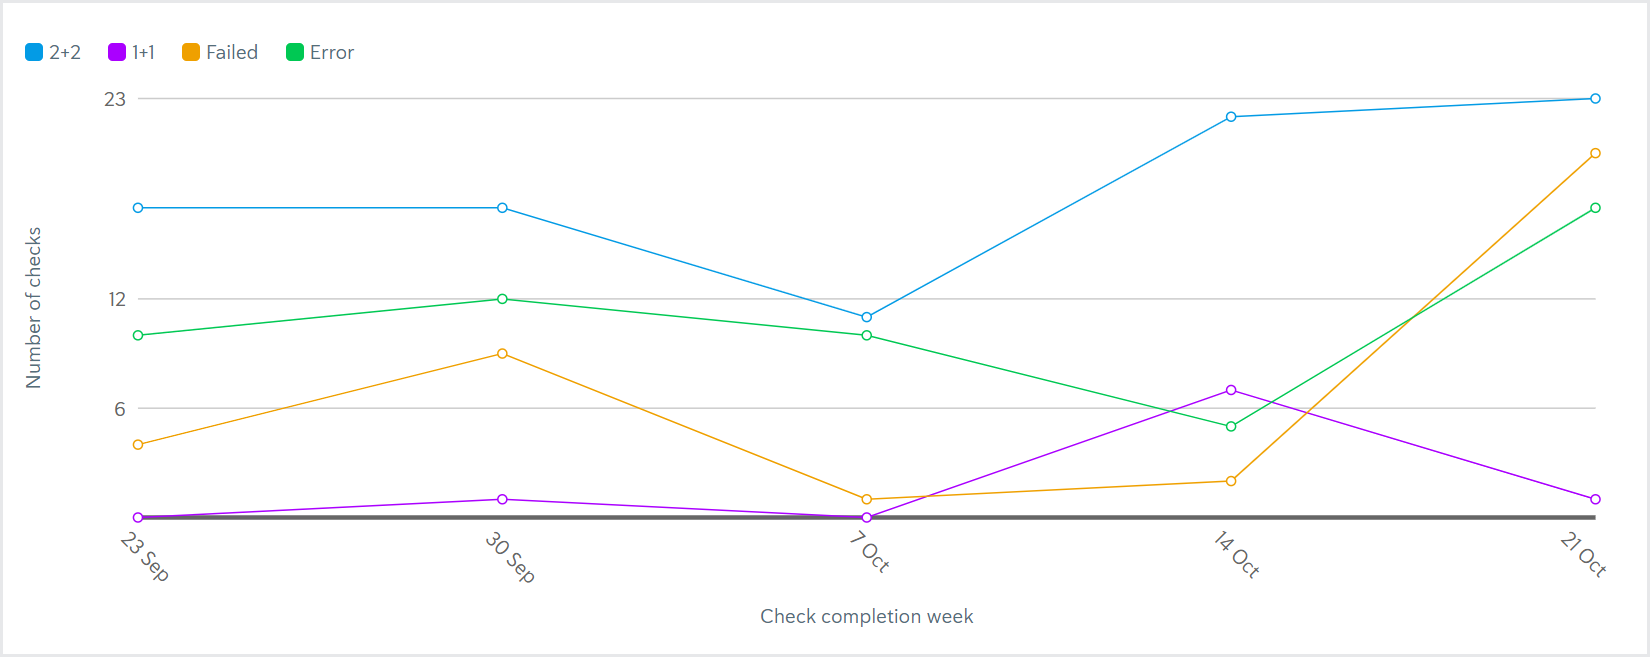
2+2: The number of Electronic identity checks completed that week that returned a 2+2 result.
1+1: The number of Electronic identity checks completed that week that returned a 1+1 result.
Fail: The number of Electronic identity checks completed that week that failed.
Error: The number of Electronic identity checks completed that week that returned an error, for example, the check was running for more than 48 hours with no result.


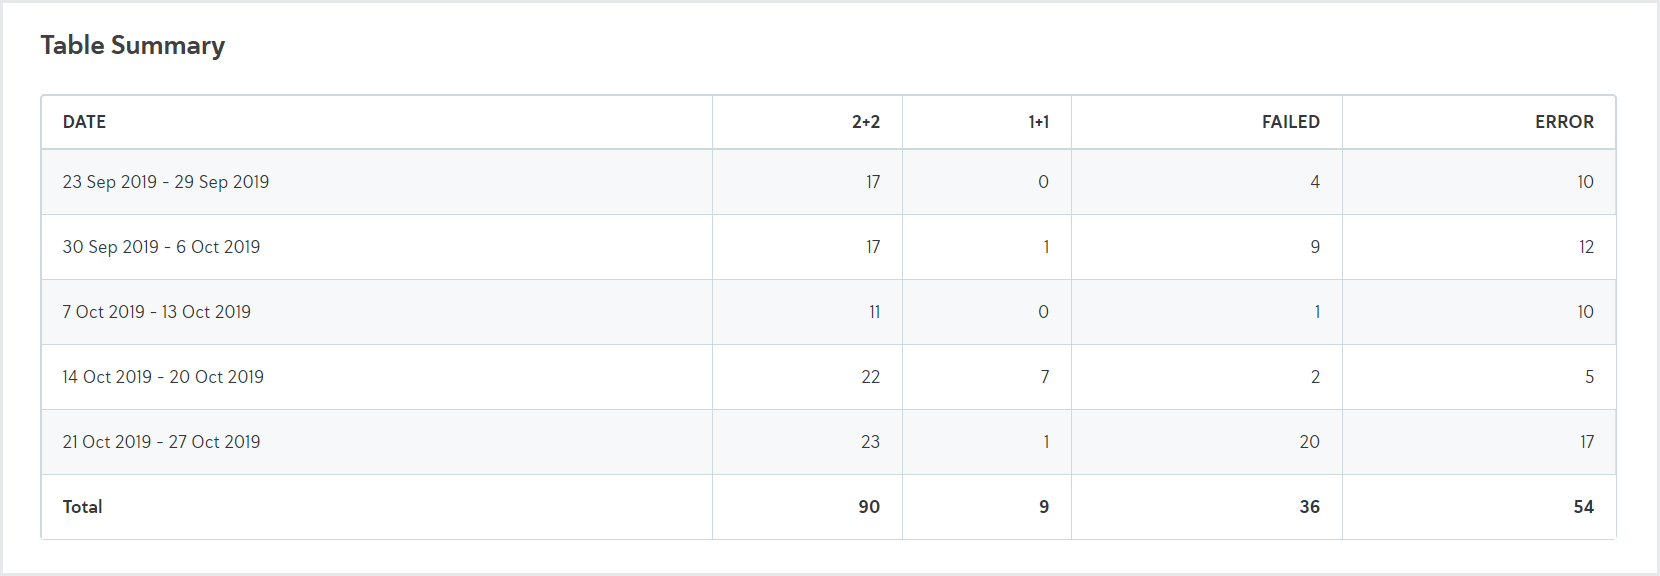
In this example, the Electronic identity check was completed 31 times the week of September 23. The check returned a 2+2 result 17 times, never returned a 1+1 result, failed 4 times, and returned an error 10 times.
Time to completion
Time to completion reports show how long it took for a percentile of checks to return a result each week, for example, pass, fail, error, 1+1.
To view the Time to completion report, go to the tab, select > , then select the check type you want to see.
There are three metrics:
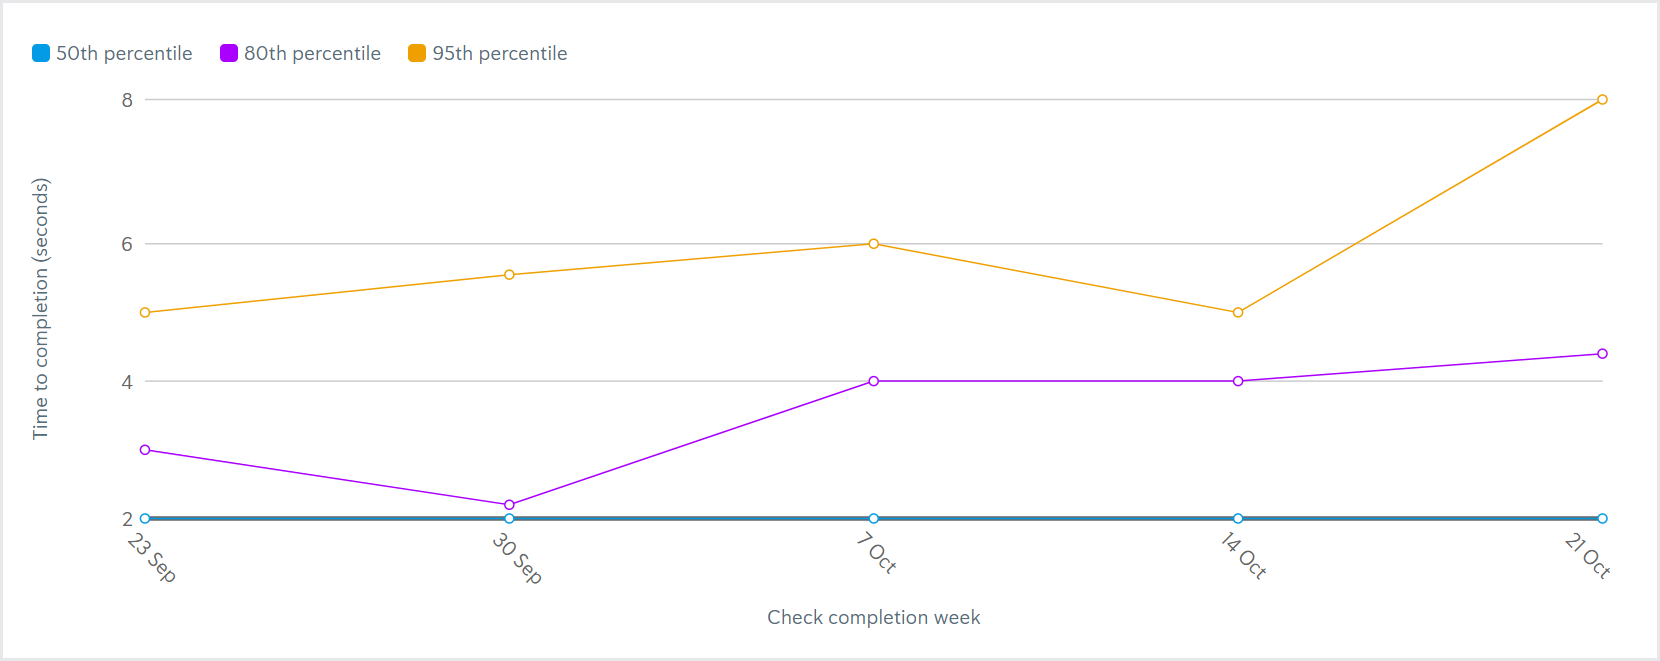
50th percentile: The amount of time it took for 50% of the checks completed that week to return a result.
80th percentile: The amount of time it took for 80% of the checks completed that week to return a result.
95th percentile: The amount of time it took for 95% of the checks completed that week to return a result.

In this example, 50% of the Electronic identity check that completed the week of September 23 returned their result in 2 seconds or less. 80% of Electronic identity checks completed that week returned their result in 3 seconds or less. 95% of Electronic identity checks completed that week returned their result in 5 seconds or less.
If the table shows 0 seconds, this means either the result was returned in less than 0.5 seconds or there is no data for that plot point, for example, no Electronic identity checks were completed in a given week.